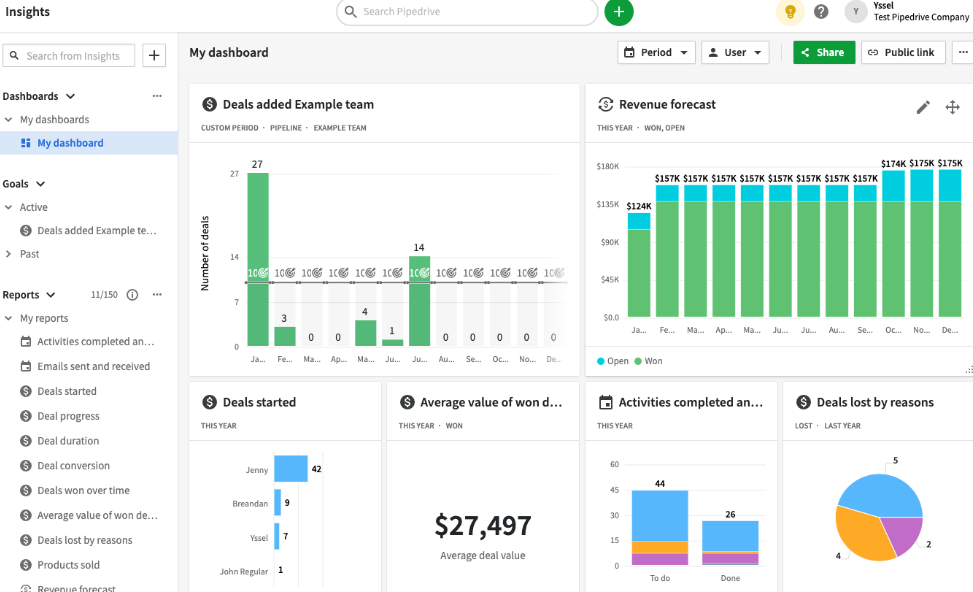
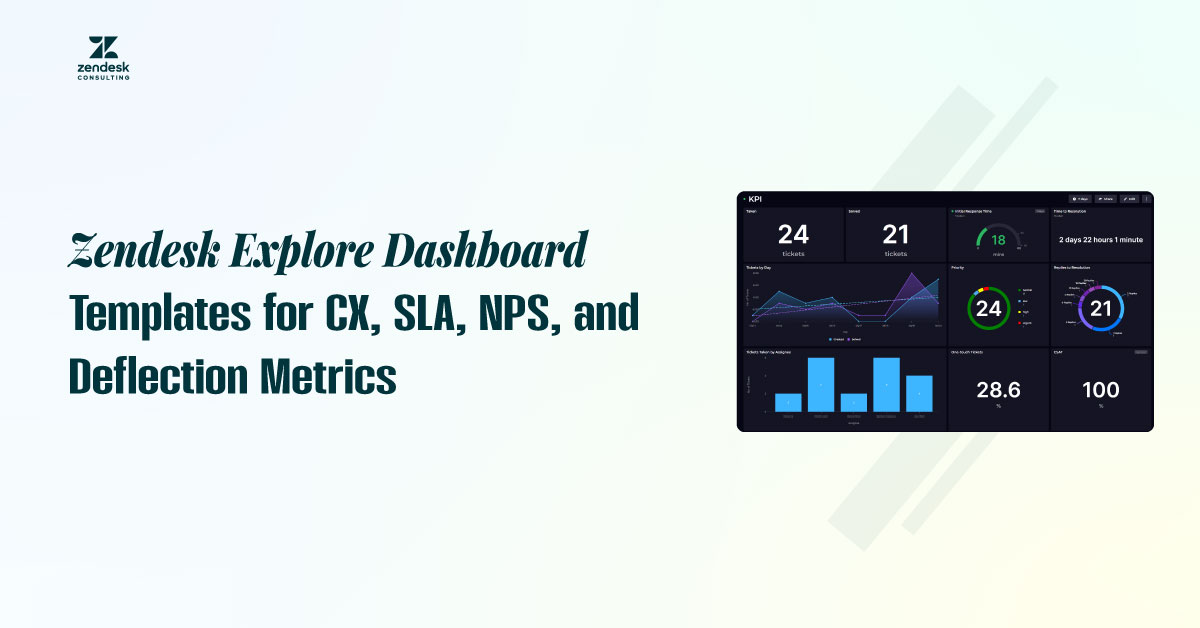
Zendesk Explore makes it easy to turn support data into actionable insights, but building dashboards from scratch can be a challenge. This Dashboard Template Pack provides pre-designed configurations for customer experience, SLA compliance, NPS tracking, agent productivity, and Help Center deflection, allowing you to launch faster and focus on improving performance.
Customer Experience (CX) Dashboard
A CX dashboard helps you track how customers feel about your service and identify areas to improve. Use it to monitor CSAT and NPS trends over time, compare satisfaction scores across various channels such as chat, email, and phone, and identify which ticket topics generate the most dissatisfaction. You can also identify top-performing agents based on their ability to improve customer sentiment, ensuring best practices are shared across the team. Filtering by date, product, or region provides even more targeted insights.
SLA Compliance Dashboard
The SLA compliance dashboard focuses on whether your team meets promised response and resolution times. Track first reply and full resolution time compliance rates, see which priority levels have the most breaches, and pinpoint issues by time of day or shift.
This allows you to spot bottlenecks and adjust staffing or workflows to improve SLA adherence. Viewing SLA data by channel or customer tier ensures you maintain quality service for your most valuable accounts.

NPS and Loyalty Dashboard

An NPS and loyalty dashboard measures customer advocacy and helps you understand how your support experience impacts long-term retention. It shows NPS trends, the balance of promoters, passives, and detractors, and highlights differences by product line or service type.
By linking NPS changes to events such as policy updates or new feature releases, you can quickly identify the impact on customer loyalty and take corrective action if necessary.
Agent Productivity Dashboard
Agent productivity dashboards help you monitor efficiency at both the individual and team level. They display the number of tickets agents resolve, the average handling time per ticket, and how backlog levels evolve.
They also track comment types and SLA compliance to identify where additional training or workflow adjustments may be needed. By balancing workloads, you ensure your team performs at its best without burning out top performers.
Help Center Deflection Dashboard
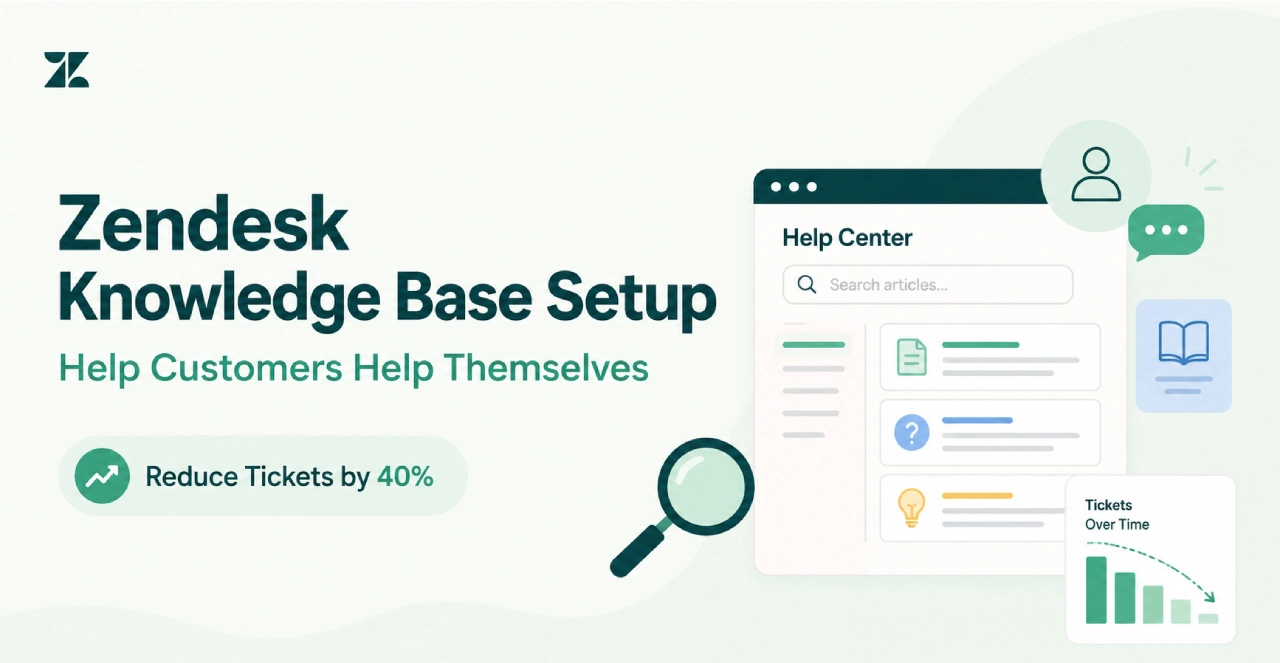
The Help Center deflection dashboard measures how well your self-service resources prevent ticket creation. It highlights which articles generate the most deflections, tracks the most-viewed Help Center content, and shows which search queries have no matching articles.
This data guides your content strategy, enabling you to create articles that address real customer needs. Over time, a strong knowledge base reduces ticket volume, improves CSAT, and empowers customers to solve issues independently.
Conclusion
When configured with the right metrics, Zendesk Explore dashboards become more than static reports; they become decision-making tools. They give you visibility into customer experience trends, SLA compliance, loyalty shifts, agent performance, and self-service effectiveness. With this information, you can allocate resources more effectively, optimize processes, and deliver a better customer experience across every channel.